Talarico’s reported Texas lead is far wider than this late poll
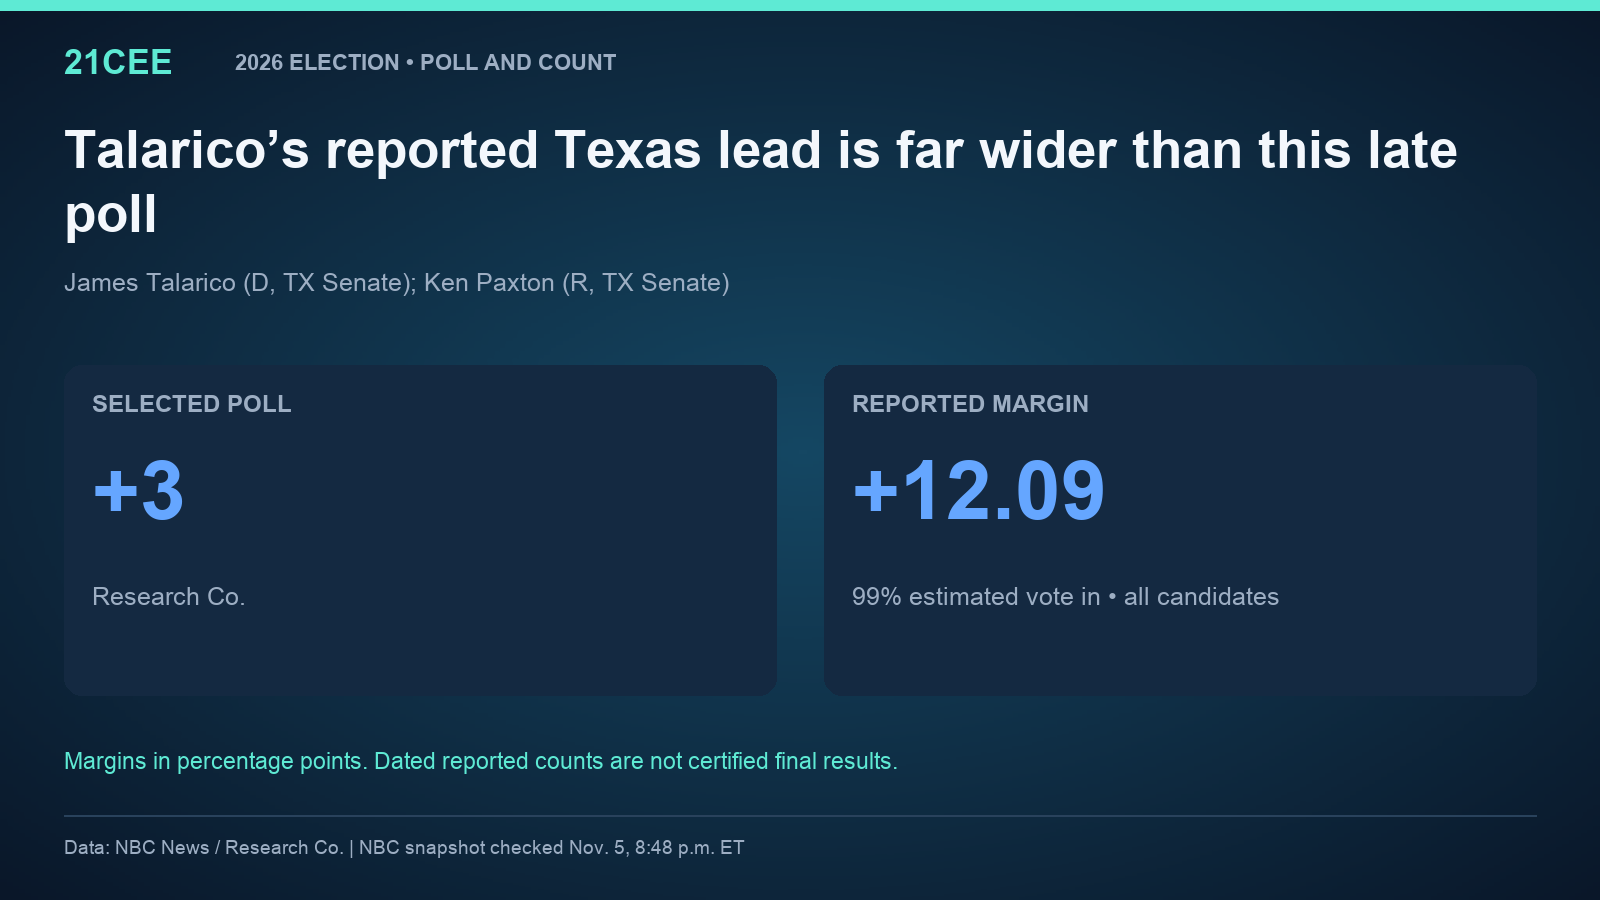
Research Co. put Talarico 3 points ahead. NBC’s November 5 evening snapshot has a 12.09-point lead, with 99% estimated vote in.
What the count shows
James Talarico (D, TX Senate); Ken Paxton (R, TX Senate). NBC News projects James Talarico as the winner. In the snapshot checked November 5 at 8:48 p.m. Eastern, Talarico had 5,445,156 votes to 4,249,763 for Ken Paxton. The reported lead was 1,195,393 votes, or 12.09 percentage points across all candidates.
The selected Research Co. poll had a 3-point Talarico lead. The reported margin is 9.09 points larger than that published poll margin. The projected winner matches the poll’s leading candidate; the size of the lead is a separate test.
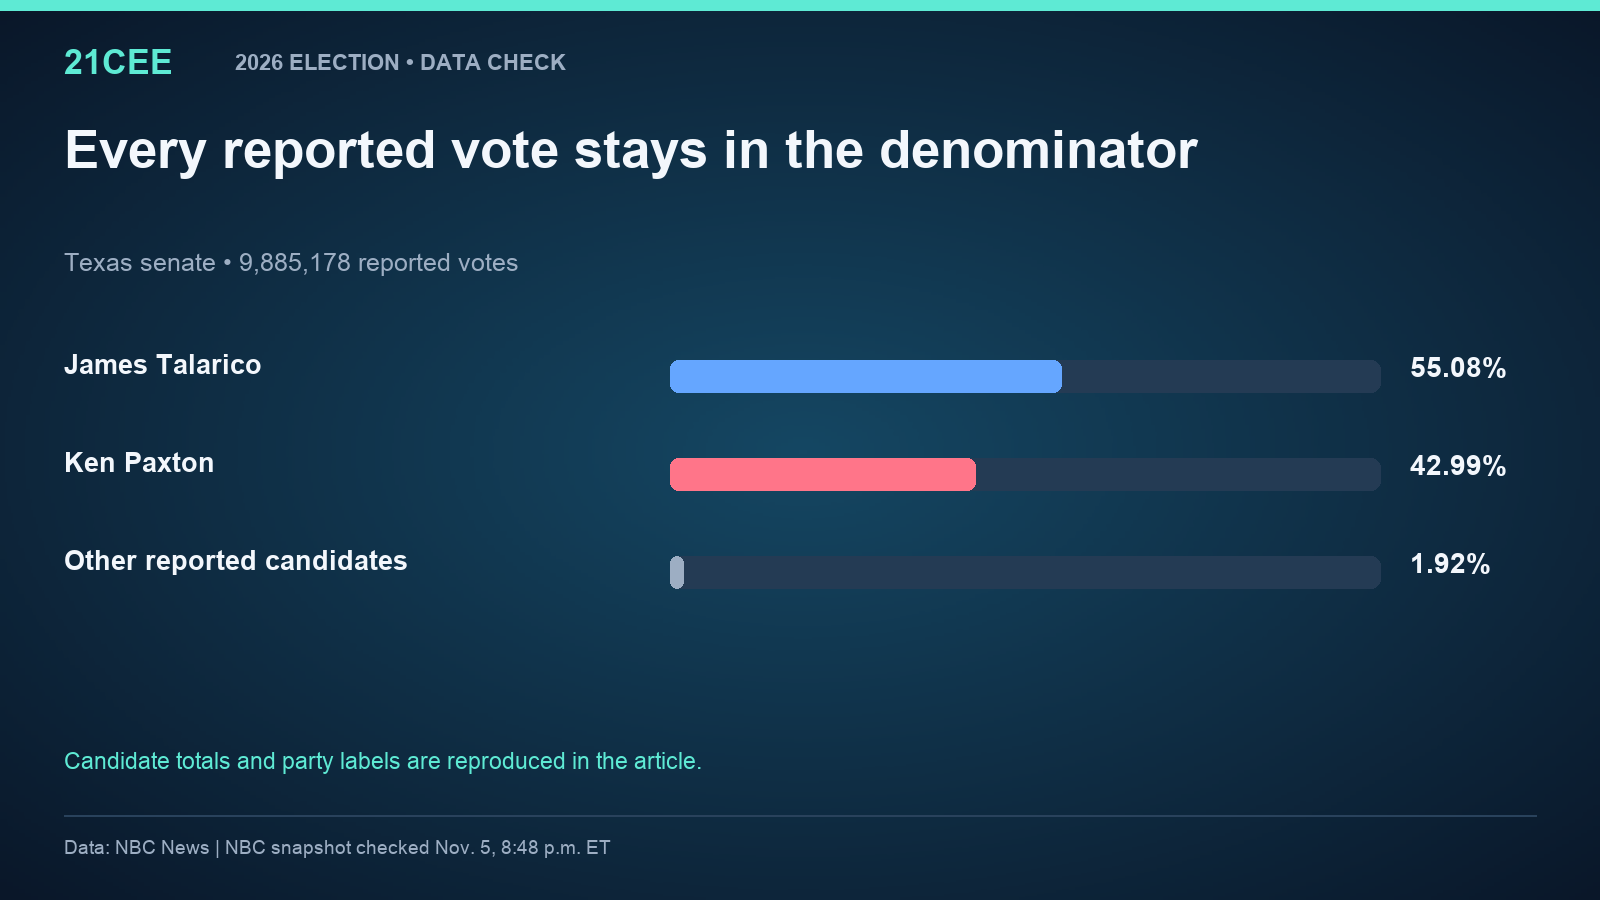
| Candidate | Source party label | Votes | Share of all votes |
|---|---|---|---|
| James Talarico | Dem | 5,445,156 | 55.0840% |
| Ken Paxton | Rep | 4,249,763 | 42.9913% |
| Ted Brown | Lib | 190,259 | 1.9247% |
| Total | 9,885,178 | 100% |
| Measure | Margin in percentage points |
|---|---|
| Selected original poll | 3 |
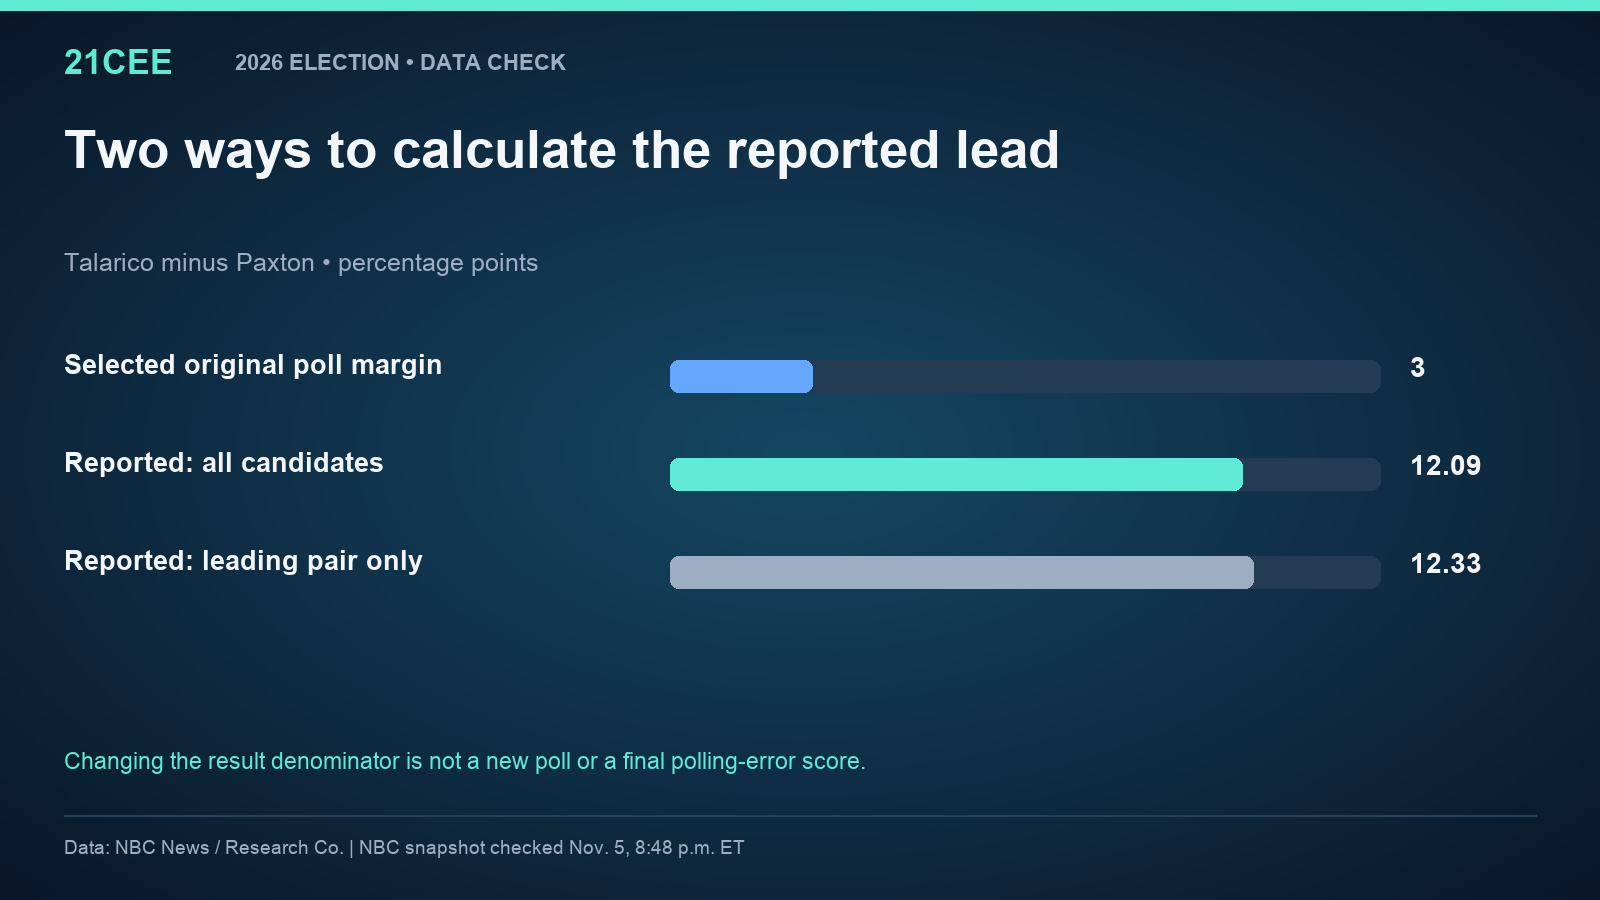
| All reported candidates | 12.092782 |
| Leading two candidates only | 12.330098 |
| Self-identified group | Reported support for Talarico |
|---|---|
| Democrats | 99% |
| Republicans | 11% |
| Independents | 64% |
What makes this comparison useful
Texas is the standout in this comparison. Research Co. had Talarico ahead before Election Day, but its three-point lead was much smaller than the reported result. Marist’s earlier October 8–11 survey, discussed in our previous coverage, is a separate baseline and should not be substituted for the later survey.
Keep the original poll intact
Research Co. surveyed 450 likely voters in Texas online, October 31–November 2. The ballot is shown among decided voters. The publisher describes age and gender weighting and reports ±4.6 percentage points for the state sample; the count of decided respondents is not separately supplied.
The selected survey’s original ballot and methods are reproduced below. It is one published poll, not a polling average or a claim that no later poll existed. Undecided responses, minor candidates, the voter screen and the field dates remain part of the record.
The survey’s stated uncertainty applies to its estimates under its method. It is not an automatic pass-or-fail cutoff for a difference between two candidates, and it cannot turn a provisional count into a final polling-error score.
| Candidate or response | Published percent |
|---|---|
| James Talarico | 51 |
| Ken Paxton | 48 |
| Ted Brown | 1 |
| Survey | Fieldwork | Population/table | Talarico | Paxton | Published lead |
|---|---|---|---|---|---|
| Marist | Oct. 8–11 | LV-weighted table; 1,196 registered-voter study total | 47% | 45% | 2pp |
| ResearchCo | Oct. 31–Nov. 2 | 450 likely voters; decided-voter ballot | 51% | 48% | 3pp |
The denominator check
Using all 9,885,178 reported candidate votes produces the 12.09-point lead. Restricting the denominator to James Talarico and Ken Paxton produces 12.33 points. Both calculations are shown so readers can see the effect rather than confuse the two measures.
For a fully two-candidate poll comparison, the published poll shares must also be renormalized. It would be misleading to change only the result denominator and describe that as a like-for-like final error.
What Texas can tell us about switching and turnout
NBC’s Texas voter survey, updated November 4 at 3:51 p.m. Eastern, offers one clue. Talarico had the reported support of 11% of self-identified Republicans, 64% of independents and 99% of Democrats. Those are preferences within each surveyed group, without moving independent leaners into a party. They are not rates of party-registration changes.
The Senate result is a statewide federal race. It cannot establish that every state or local contest moved the same way. Nor can a larger Democratic margin, by itself, separate Republican crossover from stronger Democratic turnout. Those explanations can operate together.
Crossover rates among surveyed voters describe how self-identified partisans voted. Turnout rates require a denominator that includes comparable nonvoters. Until those records support a decomposition, a precise claim that switching or turnout caused a given share of the Texas result would go beyond this evidence.
The Texas Secretary of State’s older posted count also has Talarico leading, but includes four write-in candidates absent from NBC’s three-candidate table. Our 12.09-point figure uses exactly the NBC candidate records shown here; it is not a calculation from the official state total. The two denominators should not be mixed.
Where the evidence stops
NBC estimated 99% of the vote in. This is a dated reported-count snapshot, not a certified final result. The national senate payload was updated Fri, 06 Nov 2026 01:48:30 GMT. That is the source update clock, not the original race-call time or a timestamp for an individual ballot batch.
A final polling audit should repeat the same calculations after the outcome is stable, preserving the original pre-election poll. This article does not change 21CEE’s locked forecast or claim that a polling gap proves which voters switched parties or stayed home.
Sources and calculations
Reporting: the linked original publishers. Calculations and graphics: 21CEE. Poll shares are kept as published; result margins use the exact candidate counts in the accessible table. The source clocks above describe the retained snapshot. No certification or original call time is inferred.
- Research Co.: Original published pre-election poll and methods
- Marist Poll: Original pre-election poll tables
- NBC News: NBC News senate results snapshot, checked November 5 evening
- NBC News / SSRS: NBC Texas voter survey, self-identified party question H248
- Texas Secretary of State: Texas Secretary of State posted general-election results