2026 ELECTION · POLL AND OUTCOME REVIEW
Texas: Marist put Talarico ahead before NBC’s Senate projection
Marist’s October likely-voter result gave James Talarico a two-point edge. The projected winner agrees with that ordering; the final margin audit remains unfinished.
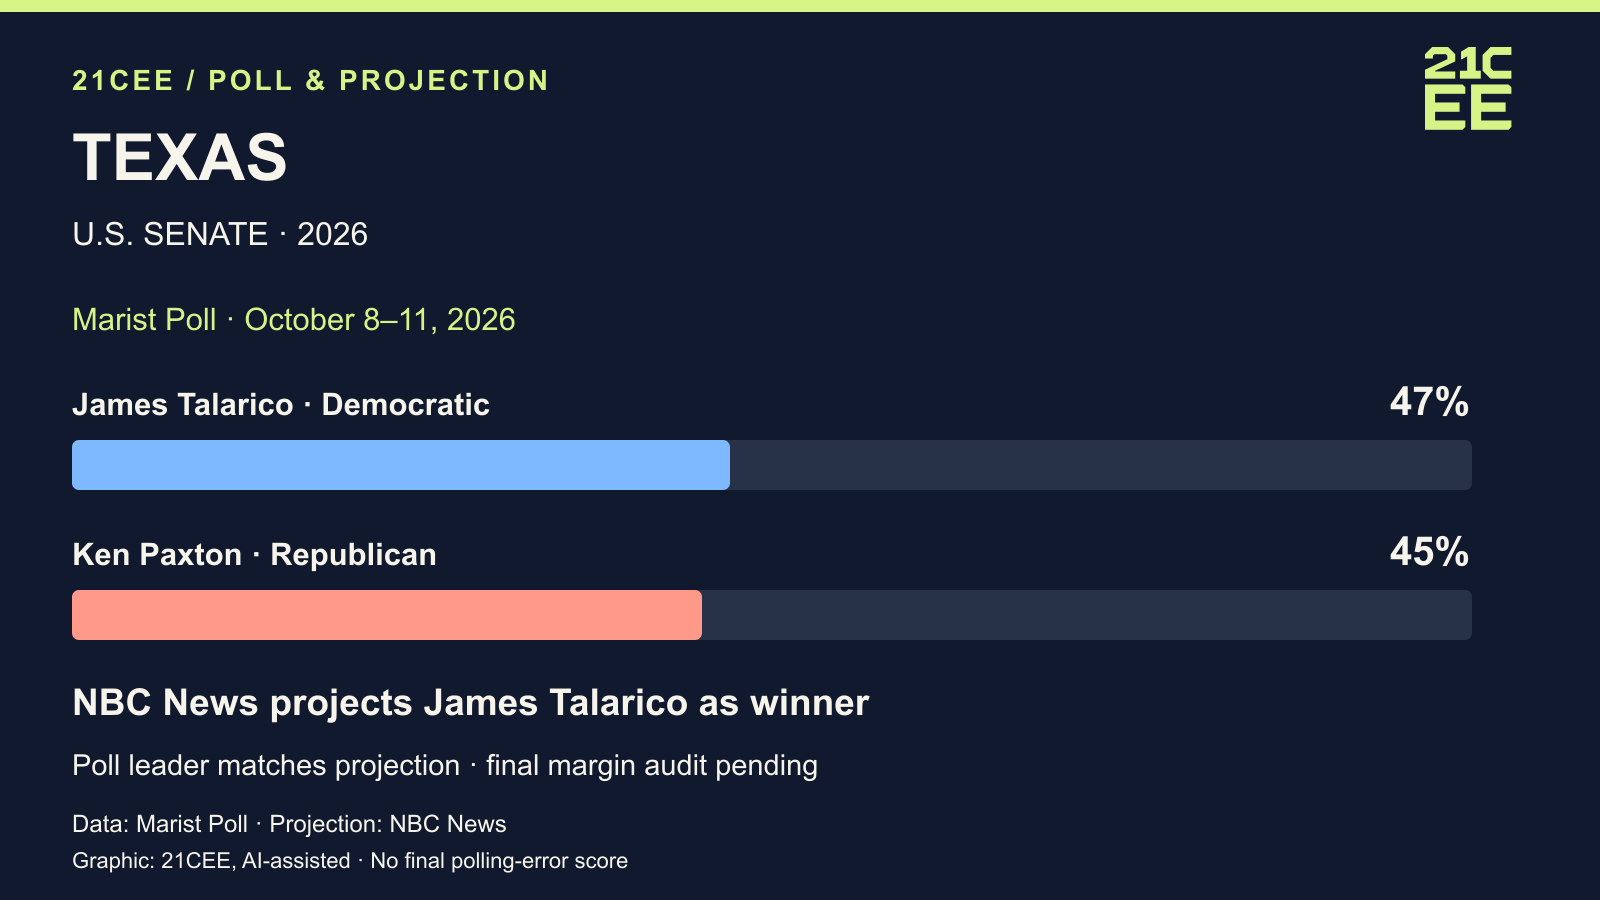
A narrow pre-election advantage
Marist put Democratic James Talarico at 47% and Republican Ken Paxton at 45% in its October 8–11 Texas Senate poll. NBC now projects Talarico as the winner. The poll’s leading candidate matches that projection, but a final margin check still has to wait for completed returns.
Keep the voter screen attached
Marist’s original table packet identifies a study of 1,196 Texas registered voters and applies a likely-voter weight based on estimated probability of voting. This article uses the likely-voter Senate table on page 7. That table gives 47% to Talarico, 45% to Paxton, 2% to another party’s candidate, 4% undecided and 2% volunteering no response. The likely-voter margin of error is ±4.9 points. These details matter because a registered-voter topline, a likely-voter topline and a final electorate are different populations. The 1,196 study total should not be mislabeled as a separately reported likely-voter subsample count.
A provisional vote comparison
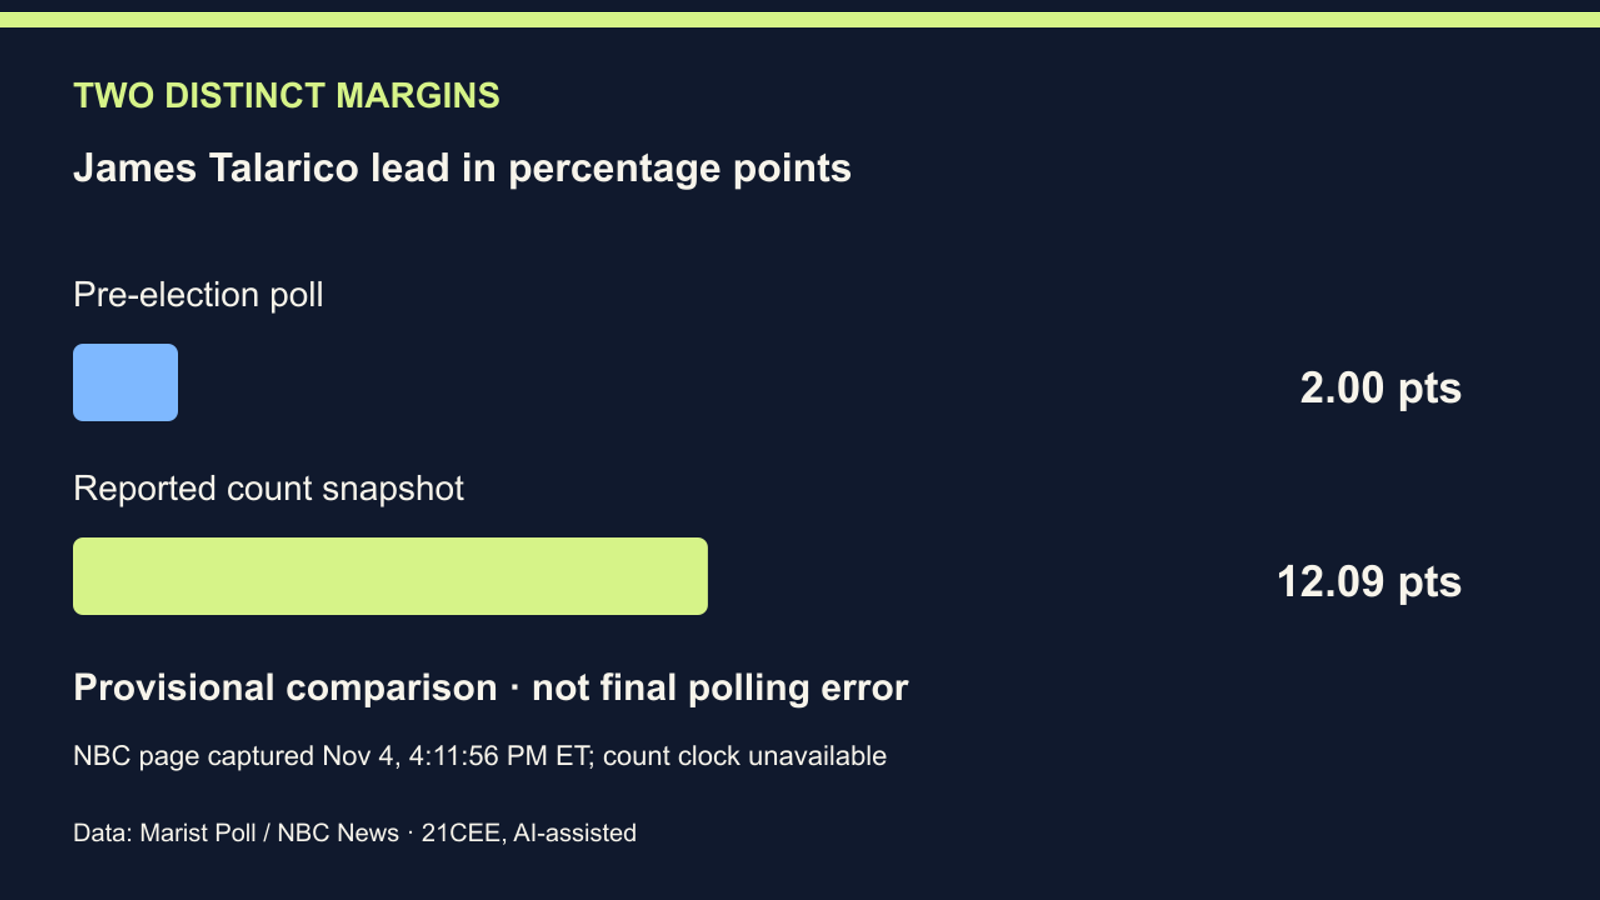
The NBC race page retrieved November 4 at 4:11:56 PM Eastern contains 5,445,121 votes for Talarico, 4,249,752 for Paxton and 190,258 for Ted Brown, totaling 9,885,131. Talarico’s lead in that retained snapshot is 1,195,369 votes, or 12.09 points of all reported votes. NBC estimates 99% of expected votes counted. The retained race summary supplies no original count-update clock; the capture time is explicitly not a count time. We preserve the page as a provisional comparison rather than presenting it as certified results.
Unresolved responses are not final ballots
The Marist table left 6% undecided or without a response, alongside 2% choosing another party. A vote file has no corresponding undecided category. Comparing raw candidate percentages therefore includes a change in what is being measured. We keep those poll categories visible rather than silently distributing them between the major candidates. A two-candidate normalization would answer a different, explicitly defined question; it cannot reveal how the undecided respondents actually voted.
The remaining audit
This first check supports a limited conclusion: the October Marist likely-voter ordering matches NBC’s projected winner. It does not establish a final numerical error, an overall pollster grade or the cause of a difference in margins. A completed assessment needs the final result and an agreed comparison rule, and should consider the interval between October interviewing and Election Day. Until then, the graphics label the survey, provisional reported count and projection as separate records.
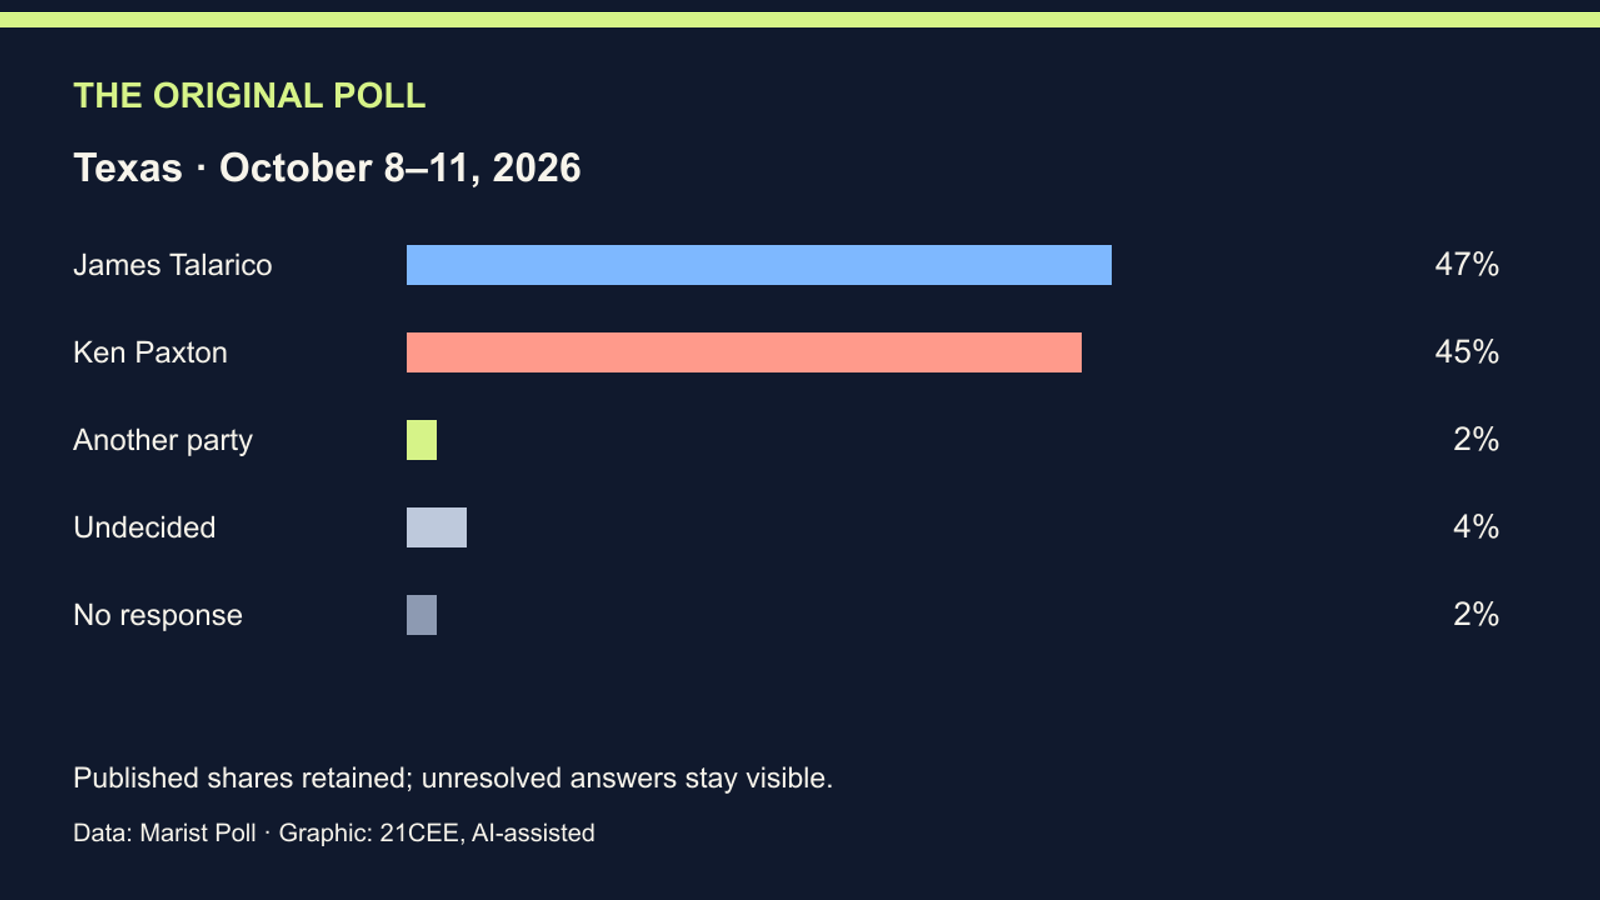
| Candidate or response | Poll share |
|---|---|
| James Talarico | 47% |
| Ken Paxton | 45% |
| Another party | 2% |
| Undecided | 4% |
| No response | 2% |
| Candidate or ticket | Votes | Reported share |
|---|---|---|
| James Talarico | 5,445,121 | 55.08% |
| Ken Paxton | 4,249,752 | 42.99% |
| Ted Brown | 190,258 | 1.92% |
| Total | 9,885,131 | 100.00% |
Original sources and method
- Original pre-election poll tables · Marist Poll
- NBC News projected-winner race page · NBC News
Poll margin = first candidate’s published percentage minus second candidate’s. Provisional count margin = 100 × (first candidate’s votes − second candidate’s votes) ÷ all reported votes. A winner projection and a certified count are distinct. Counts remain unofficial; this story does not treat either the retrieval clock or the network’s projection as a final tally.