Rhoden’s South Dakota lead is wider than Emerson’s poll
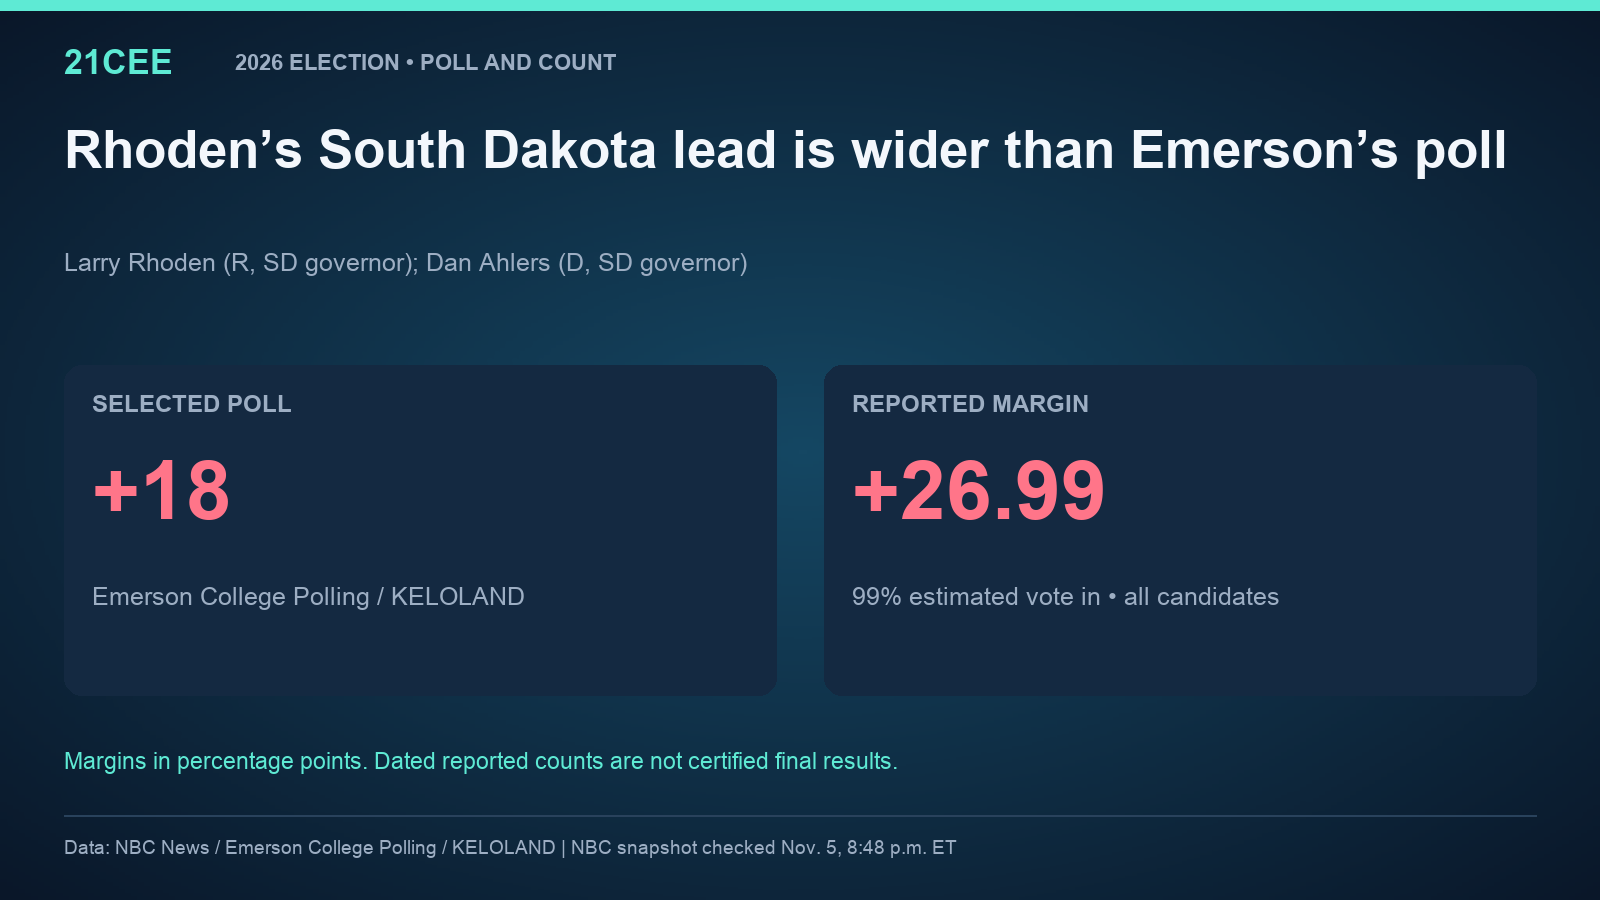
Emerson College Polling / KELOLAND put Rhoden 18 points ahead. NBC’s November 5 evening snapshot has a 26.99-point lead, with 99% estimated vote in.
What the count shows
Larry Rhoden (R, SD governor); Dan Ahlers (D, SD governor). NBC News projects Larry Rhoden as the winner. In the snapshot checked November 5 at 8:48 p.m. Eastern, Rhoden had 193,333 votes to 111,157 for Dan Ahlers. The reported lead was 82,176 votes, or 26.99 percentage points across all candidates.
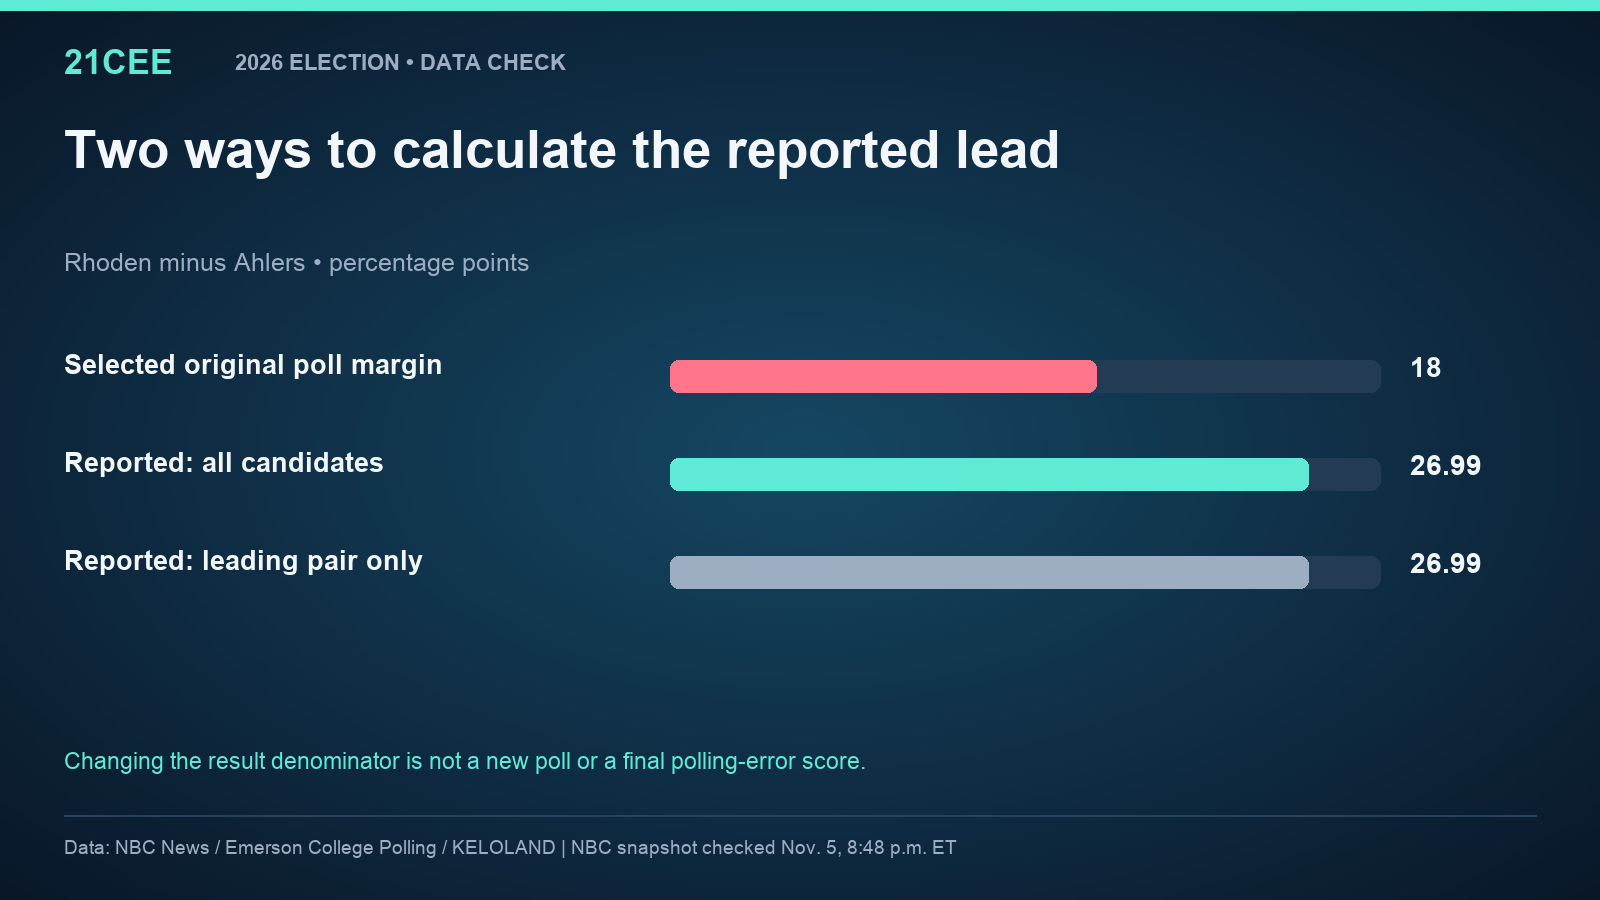
The selected Emerson College Polling / KELOLAND poll had a 18-point Rhoden lead. The reported margin is 8.99 points larger than that published poll margin. The projected winner matches the poll’s leading candidate; the size of the lead is a separate test.
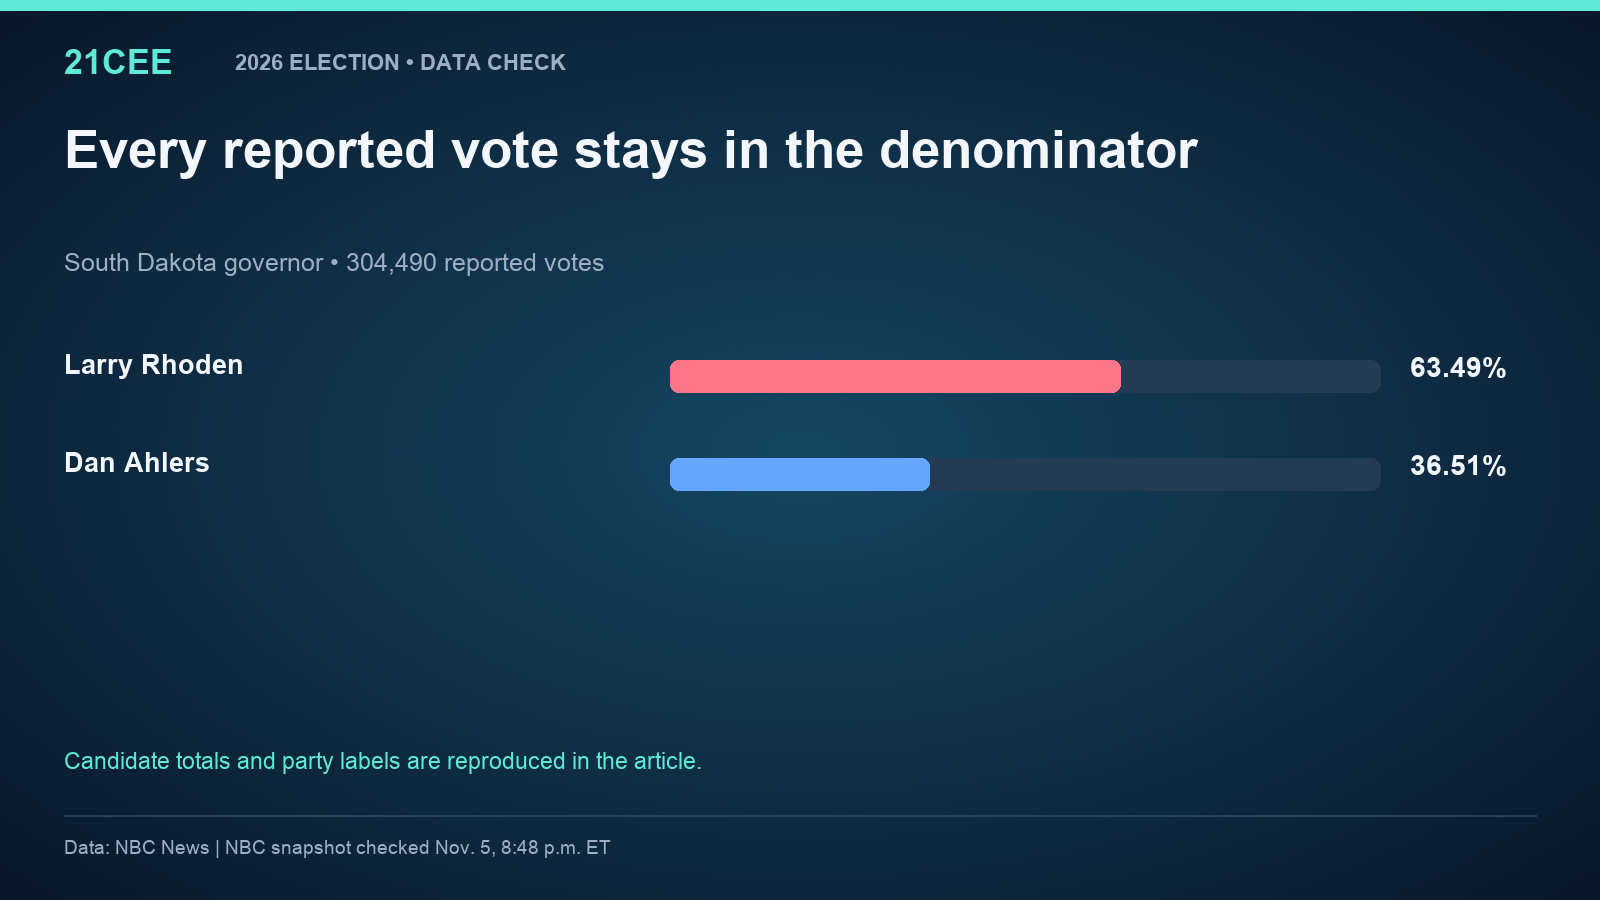
| Candidate | Source party label | Votes | Share of all votes |
|---|---|---|---|
| Larry Rhoden | Rep | 193,333 | 63.4940% |
| Dan Ahlers | Dem | 111,157 | 36.5060% |
| Total | 304,490 | 100% |
| Measure | Margin in percentage points |
|---|---|
| Selected original poll | 18 |
| All reported candidates | 26.988078 |
| Leading two candidates only | 26.988078 |
What makes this comparison useful
Emerson’s initial South Dakota governor question gave Rhoden 56% and Ahlers 38%, with 6% undecided. The reported count has only the two named candidates, so its all-candidate and two-candidate margins are the same. The count is wider than that original 18-point poll lead.
Keep the original poll intact
Emerson interviewed 803 likely South Dakota voters October 19–21 and released the study October 23. It reports a ±3.5-point credibility interval. This article uses the initial 56–38 ballot, before undecided respondents were allocated through a leaner question.
The selected survey’s original ballot and methods are reproduced below. It is one published poll, not a polling average or a claim that no later poll existed. Undecided responses, minor candidates, the voter screen and the field dates remain part of the record.
The survey’s stated uncertainty applies to its estimates under its method. It is not an automatic pass-or-fail cutoff for a difference between two candidates, and it cannot turn a provisional count into a final polling-error score.
| Candidate / response | Published share |
|---|---|
| Larry Rhoden | 56% |
| Dan Ahlers | 38% |
| Undecided | 6% |
The denominator check
Using all 304,490 reported candidate votes produces the 26.99-point lead. Restricting the denominator to Larry Rhoden and Dan Ahlers produces 26.99 points. Both calculations are shown so readers can see the effect rather than confuse the two measures.
For a fully two-candidate poll comparison, the published poll shares must also be renormalized. It would be misleading to change only the result denominator and describe that as a like-for-like final error.
Where the evidence stops
NBC estimated 99% of the vote in. This is a dated reported-count snapshot, not a certified final result. The national governor payload was updated Fri, 06 Nov 2026 01:46:11 GMT. That is the source update clock, not the original race-call time or a timestamp for an individual ballot batch.
A final polling audit should repeat the same calculations after the outcome is stable, preserving the original pre-election poll. This article does not change 21CEE’s locked forecast or claim that a polling gap proves which voters switched parties or stayed home.
Sources and calculations
Reporting: the linked original publishers. Calculations and graphics: 21CEE. Poll shares are kept as published; result margins use the exact candidate counts in the accessible table. The source clocks above describe the retained snapshot. No certification or original call time is inferred.