21CEE · ELECTION ANALYSIS · NOVEMBER 4, 2026
New lines, uneven returns: Texas, Florida and North Carolina after the remaps
21CEE analysis · AI-assisted
Texas count: Nov. 4, 4:25 p.m. Central. NBC records: observed 5:28 p.m. Eastern. Unofficial leads and projections are distinct; no certification is claimed.
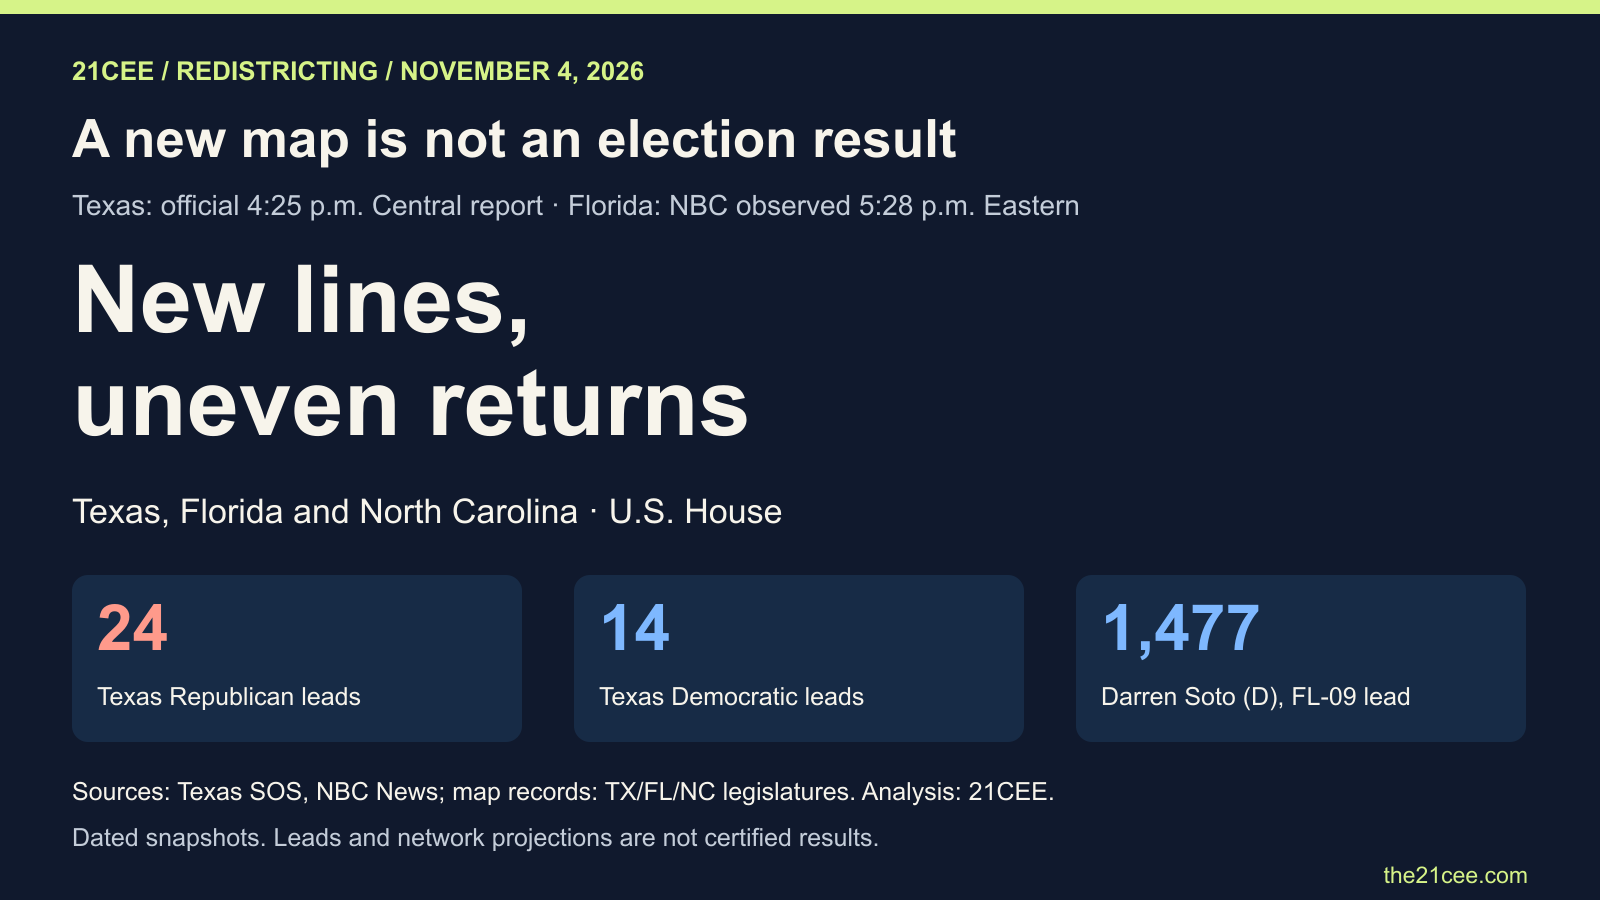
The new district lines were in place. The promised political gains still had to survive an election. Texas’s official November 4 report showed Republican candidates leading 24 U.S. House districts and Democrats leading 14 under Plan C2333. In Florida, NBC News had projected Democratic winners in three closely watched districts while leaving the 9th District uncalled in the record reviewed here. Those are useful facts about the election conducted under the new maps. They are not a measure of how many seats the maps themselves created or cost either party.
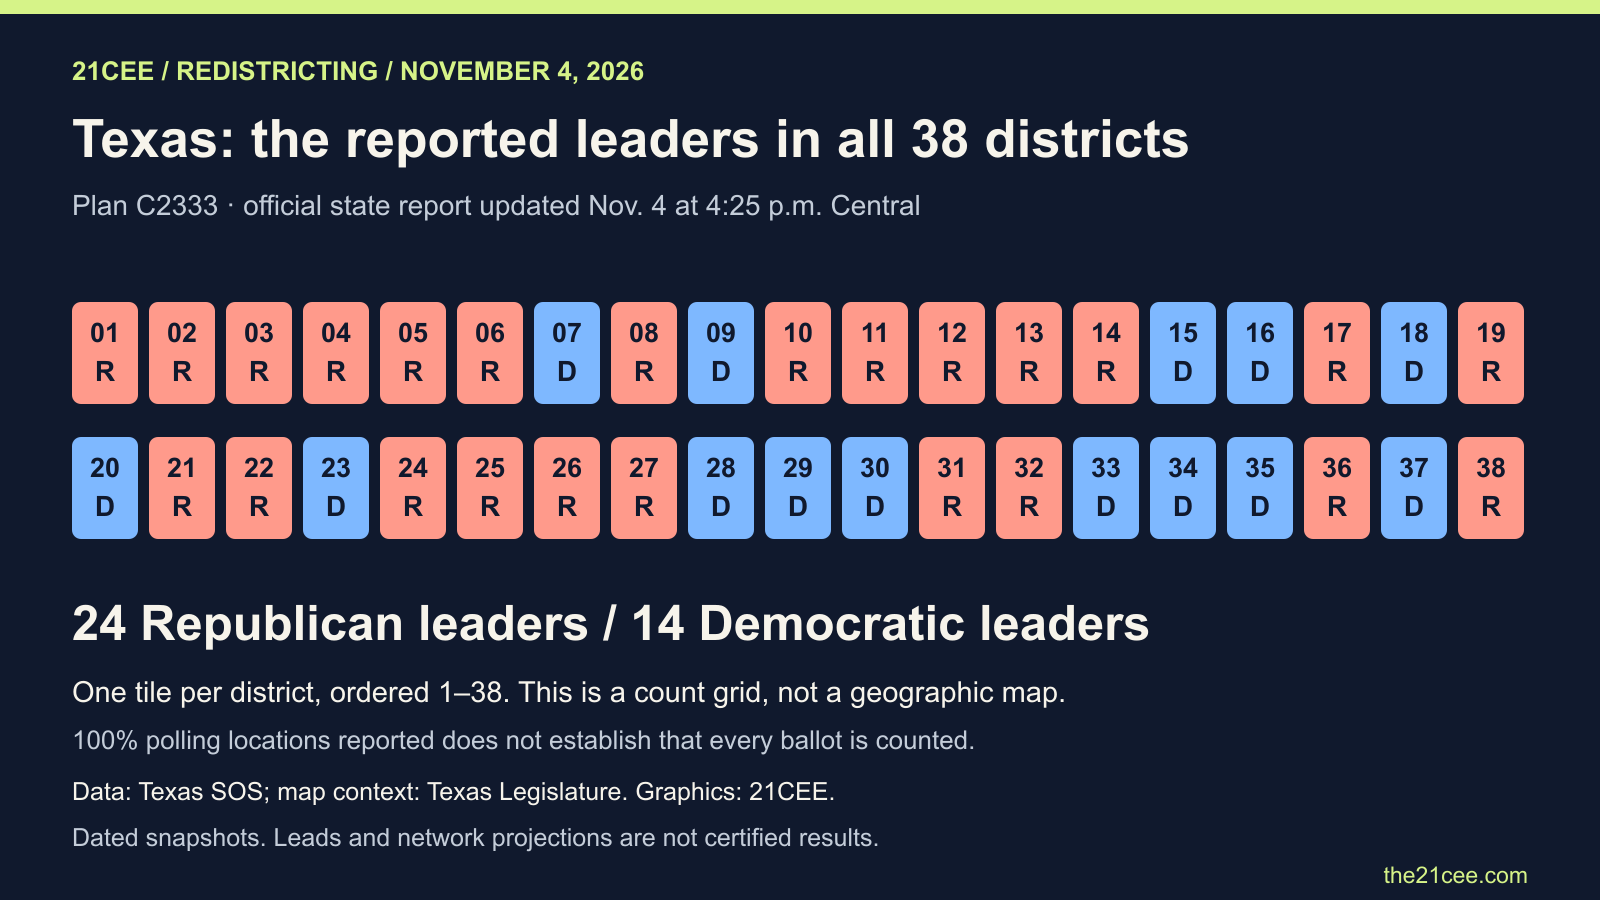 Texas SOS, Nov. 4 at 4:25 p.m. Central. Count grid, not geography. Analysis and graphic: 21CEE.
Texas lawmakers made the political rationale explicit. The House committee analysis said the replacement map was meant to reflect the Republican presidential nominee’s increased statewide vote share. Governor Greg Abbott signed House Bill 4 on August 29, 2025. The Texas Legislative Council identifies C2333 as the plan used in the 2026 elections; C2193 still describes the districts represented by the outgoing Congress until January 2027. The court history also moved beyond last winter’s temporary stay: the U.S. Supreme Court reversed the lower-court judgment on April 27, 2026, and its docket records judgment issued on May 29.
The Texas returns were updated at 4:25 p.m. Central on November 4, two minutes before 21CEE captured them. All 38 House contests listed 100% of polling locations reporting. That label is not certification and does not tell us that every mail, provisional or other outstanding ballot has been included. The narrowest reported first-versus-second-place margin was in the 2nd District, where Republican U.S. House candidate Steve Toth of Texas led by 5,581 votes, or 1.97 percentage points of all reported votes. Republican U.S. House candidate Jace Yarbrough’s lead over Democratic U.S. House candidate Dan Barrios in Texas’s 32nd District was 8,053 votes, or 2.90 points. This article reports leads from that state snapshot and makes no independent Texas race calls.
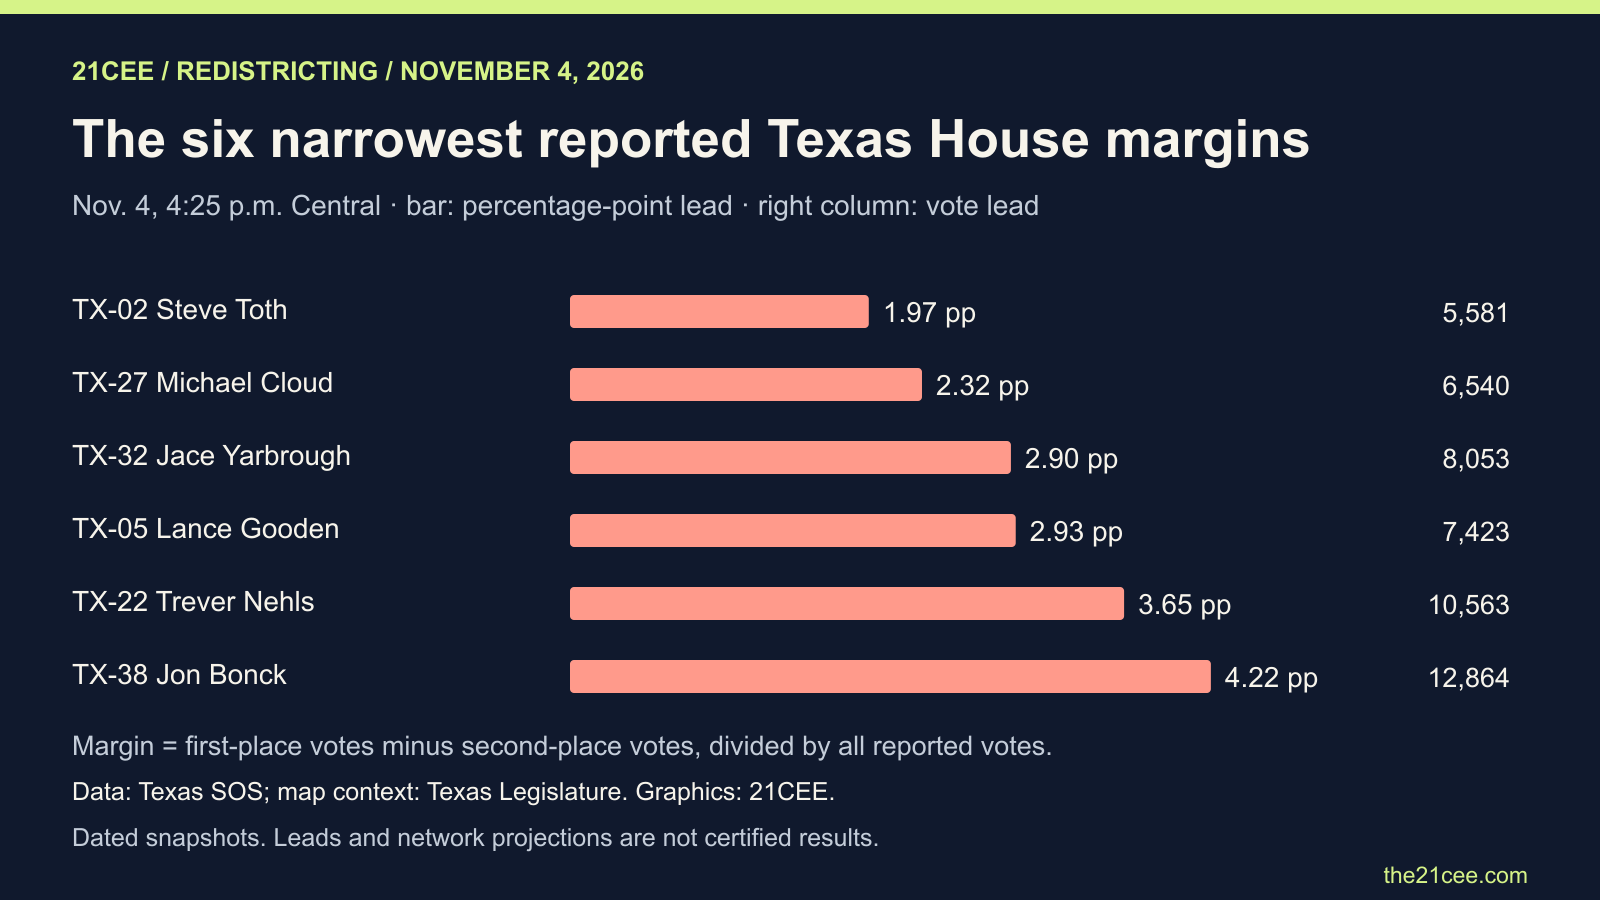 Margins use all candidates in the denominator. Data: Texas SOS. Analysis and graphic: 21CEE.
Florida’s new map, EOGPCRP2026, passed the legislature as House Bill 1-D on April 29 and was signed on May 4. The difference between a lead and a projection is especially important there. Democrat Darren Soto led Republican Dan Green in the 9th District by 143,174 to 141,697 in both the official result page and NBC’s captured record: just 1,477 votes, or 0.52 percentage points using the full 284,871-vote denominator. NBC had not projected a winner in that record. Its separate projected Democratic U.S. House winners in Florida were Kathy Castor in the 14th District, Pia Dandiya in the 22nd and Jared Moskowitz in the 25th. The district numbers here follow the 2026 map, not their older boundaries.
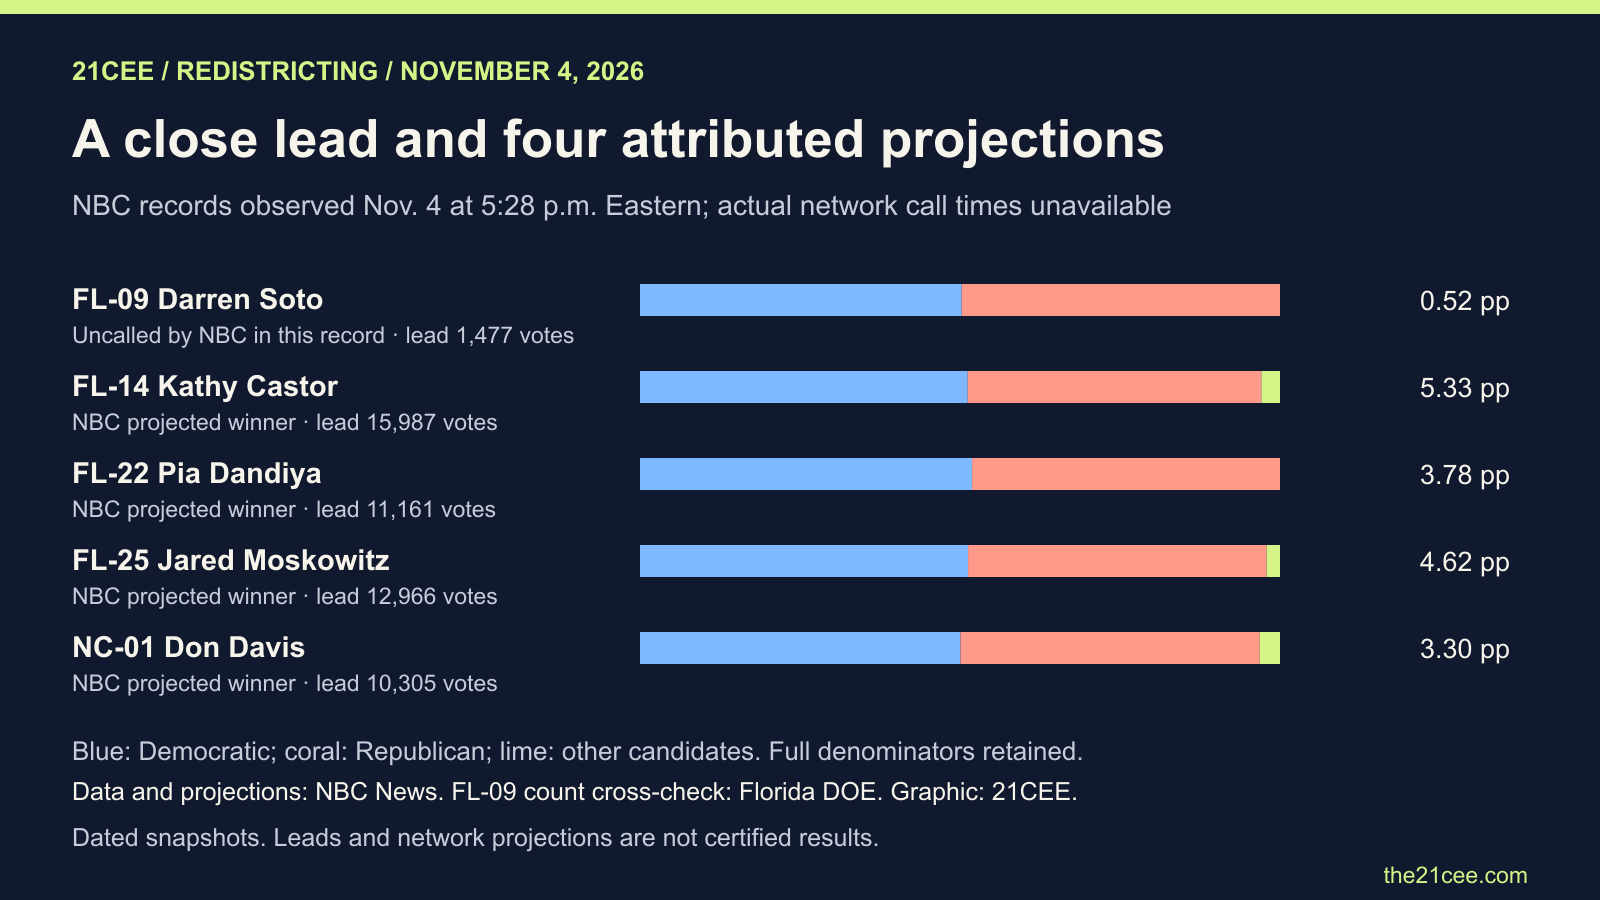 NBC projections observed at 5:28 p.m. Eastern; count timestamps unavailable in these records. Data: NBC; FL09 cross-check: Florida DOE. Graphic: 21CEE.
North Carolina’s operative map is C2025E, enacted on October 22, 2025 as Senate Bill 249, Session Law 2025-95. The statute rewrote G.S. 163-201 to realign the 1st and 3rd U.S. House districts, and the legislature’s map page explicitly identifies its use for the 2026 election. Republican leaders stated their political objective before passage: in an October 13 release from Senate Leader Phil Berger’s press shop, House Speaker Destin Hall said they intended to create an additional Republican congressional seat. That establishes their stated goal, not the number of seats the map caused. NBC’s November 4 record projected Democratic U.S. House candidate Don Davis in North Carolina’s 1st District over Republican U.S. House candidate Laurie Buckhout. Its count showed Davis at 156,564 votes and Buckhout at 146,259, with Libertarian U.S. House candidate Tom Bailey at 9,880: a 10,305-vote lead across 312,703 reported votes. NBC estimated 98.7% of the vote in, which is not a certified or final margin.
North Carolina originals: operative C2025E map; Session Law 2025-95; legislative leaders’ October 13 purpose statement; NBC’s attributed projection and reported votes.
Missouri belongs in a different category. The U.S. Supreme Court’s September 25 order required use of its 2022 map for this election while the newer map remained tied to a referendum. Missouri’s 2026 House outcomes therefore do not test the 2025 Republican redraw. This article does not report the referendum’s outcome.
The lesson from these snapshots is narrower than a victory lap for either side. A legislature can change who shares a district; it cannot assign the votes those residents cast. To estimate the effect of the remaps, an analyst would need a defensible comparison using the same electorate under alternative boundaries, with turnout and candidate differences accounted for. These returns do not supply that counterfactual. They do show why every post-election map scorecard needs three separate columns: which boundaries actually governed, what the reported votes say, and which races a named outlet has called.
Reported vote data
Original sources and methods
Texas values are the source’s explicit 4:25 p.m. Central snapshot. NBC observation time is not the time each vote was counted or each race was called. NBC figures retain all listed candidates, including third-party votes. The three numerical charts use reported returns; no invented boundary geometry or causal seat estimate is presented. NBC’s state pages were updated at 5:27 p.m. Eastern; that page clock is not an exact race-count or call time. The official Florida page supplied no count-update clock. The Florida 25th official snapshot differed from NBC by two votes for each major-party candidate (143,753 and 130,787 versus NBC’s 143,755 and 130,789); this chart consistently uses the NBC record, with the same 12,966-vote lead. This is a selected set of races, not an exhaustive national scorecard. Original map records are linked above. Analysis and graphics: 21CEE, AI-assisted.